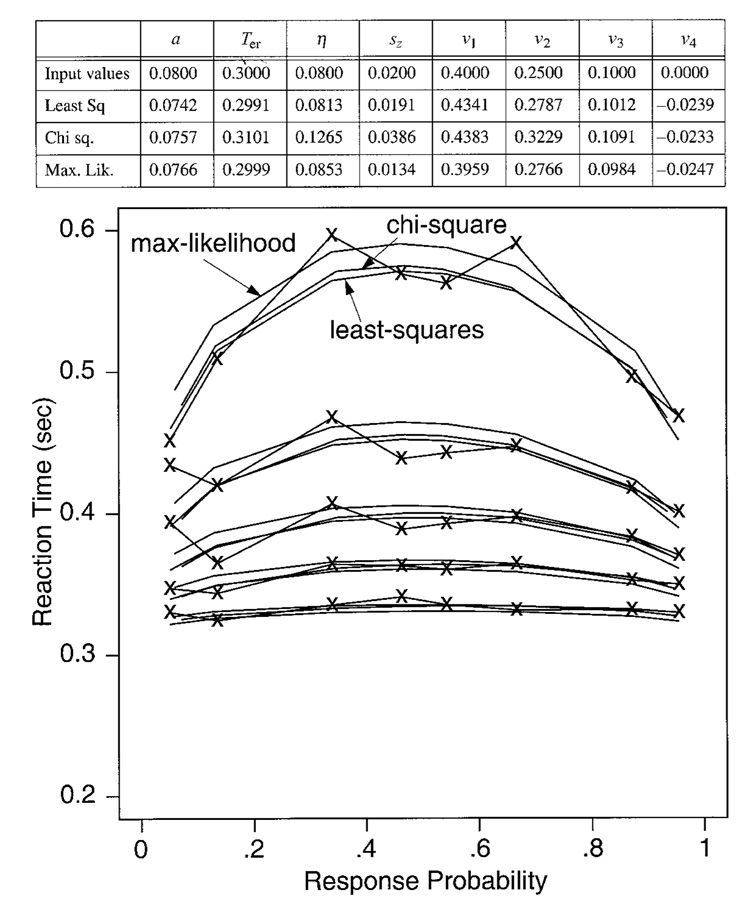
Figure 8.
A sample fit of the three methods (maximum likelihood, chi-square, and weighted least squares) to one set of simulated data (the Xs). The parameters are shown at the top, and the parameters used to generate the simulated data are in the column headings of the table. The top theoretical function (for each of the five quantiles) is from the maximum likelihood method, the middle function is from the chi-square method, and the lower function is from the weighted least squares method.

