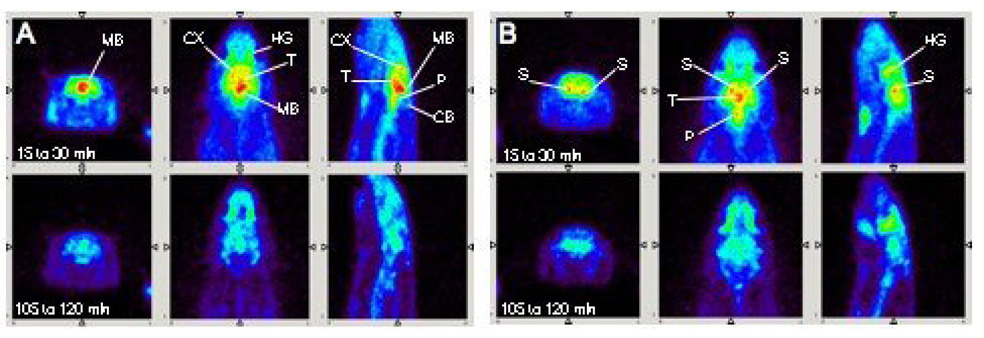
Figure 4.
While under isoflurane anesthesia, 1.2 mCi of [18F]1 was injected through a catheter placed into the tail vein and scanning commenced. A-PET images (coronal, transverse, and sagittal views shown) of [18F]1 localization in rat brain nicely reflect known areas of SERT distribution. Total scan time was four hours. Two time frames were selected to be shown here (15 to 30 and 105 to 120 min). A: [18F]1 localized in the midbrain (MB), cortex (CX), and thalamus (T) which are regions where SERT binding sites are concentrated. Activity due to non-specific binding was detected in the Harderian glands (HG); this non-specific binding is commonly observed in rats and mice for other PET agents [45–47]. Little uptake is seen in the cerebellum, a region with low SERT density. B: A different plane shows [18F]1 localization in another SERT-rich region, the striatum (S). A clear separation can be seen between the left and right striatum suggesting the usefulness of A-PET in imaging discrete structures in the brain.

