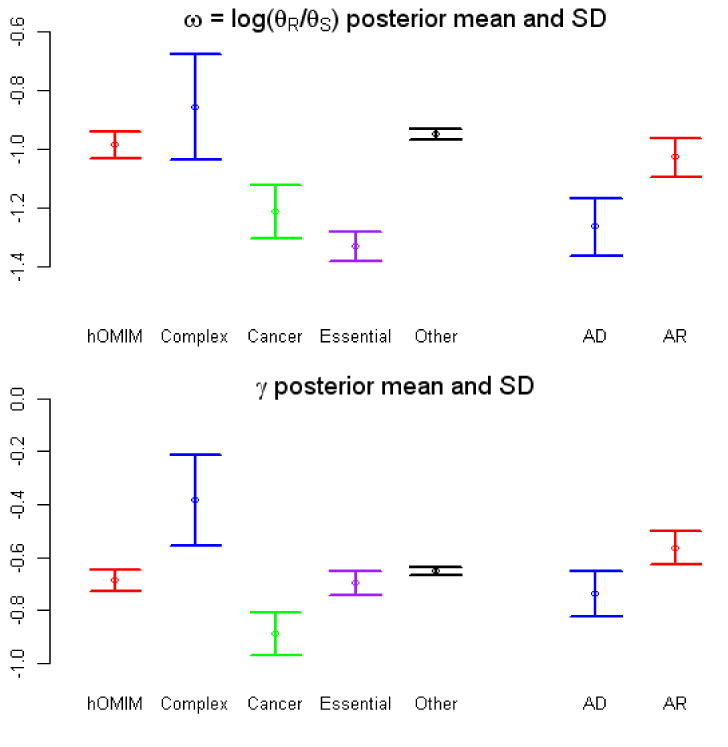
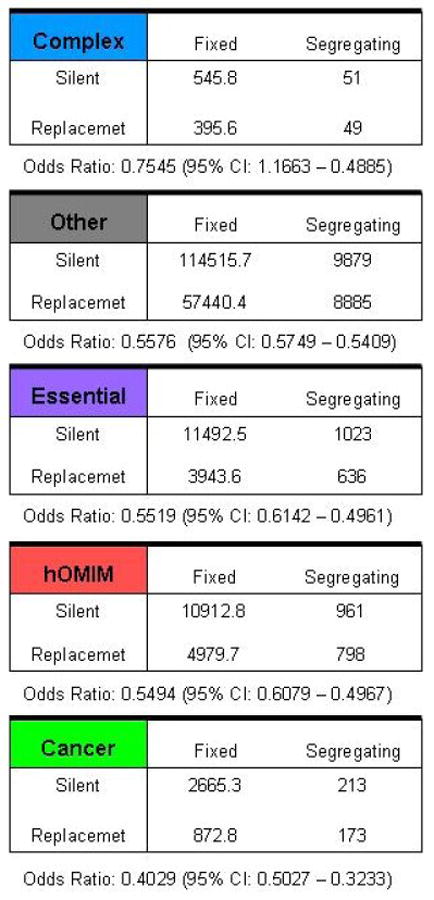
Figure 3.


Estimate of two parameters, ω and γ, obtained from pooled polymorphism and divergence data in different categories of genes, including those in hOMIM, those associated with complex disease susceptibility (“complex”), with cancer (“cancer”), for which knock-outs are inviable or sterile in mice (“essential”) and genes in none of the above categories (“other”). Genes in hOMIM are further broken down into two categories, depending on whether mutations cause dominant (“AD”) or recessive (“AR”) disease phenotypes. Shown are the mean and the standard deviation of the posterior distribution estimate for each parameter. The parameter ω=log(θR/θS) can be thought of as the fraction of amino-acid mutations that contribute to polymorphism i.e., are neutral or nearly neutral (θR is the effective mutation rate at replacement sites and θS at synonymous sites), while γ is the selection coefficient acting on mutations in a category of genes. The estimates are obtained by assuming one selection coefficient γ for all mutations within a category; given this unrealistic assumption, the value of the γ estimate is less informative than the ordering for the different categories (see SOM for details). Summaries of the pooled polymorphism and divergence data for genes in each category are given in the last panel (see Methods for details). We note that γ can also be thought of not as a parameter estimate but as a summary of the pooled tables for each category, thereby capturing similar information to the odds ratio (shown below).
