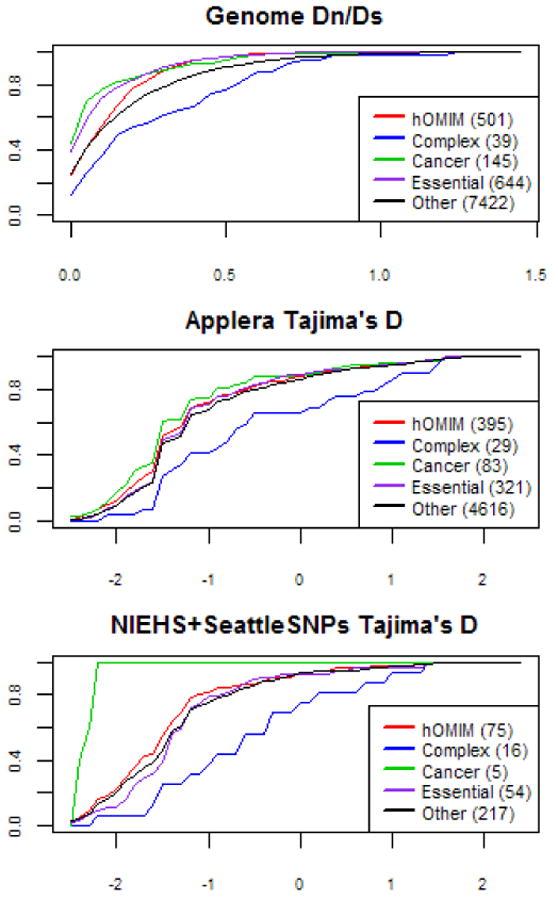
Figure 4.

Cumulative distributions of Dn/Ds and Tajima's D for hOMIM, genes associated with complex disease susceptibility (“complex”), in which mutations are associated with cancer (“cancer”), for which knock-outs are inviable or sterile in mice (“essential”) and genes in none of the above categories (“other”). For other details, see legend of Figure 2. The distributions of Dn/Ds are significantly different in all pairwise comparisons (at the 5% level), other than in the comparisons of “essential” genes vs. “cancer” genes and of “other” genes vs. “complex” disease, where significance is marginal (see Supplementary Table 1). The distributions of Tajima's D values in the larger Applera dataset (shown here for the European samples) are significantly different for genes associated with complex diseases vs. either hOMIM or generic genes at the 5% level (see Supplementary Table 1); all other pairwise comparisons are also significant, other than cancer vs. hOMIM, hOMIM vs. essential, and other vs. essential.
