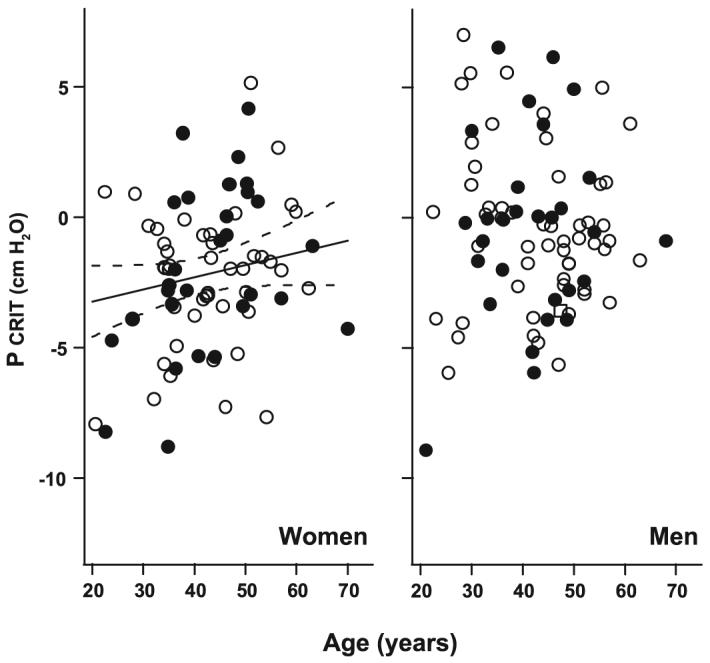
Fig. 3.

Passive Pcrit vs. age relationship in men and women. In the entire group, there was a significant correlation (solid line) between passive Pcrit and age (adjusted for BMI) in women, but not men (no line drawn). Note that the distribution of the subjects in the subset matched for RDI and BMI (closed symbols) did not differ from the distribution in the entire subject groups (open and closed symbols) for both men and women. Dashed lines represent 95% CIs.
