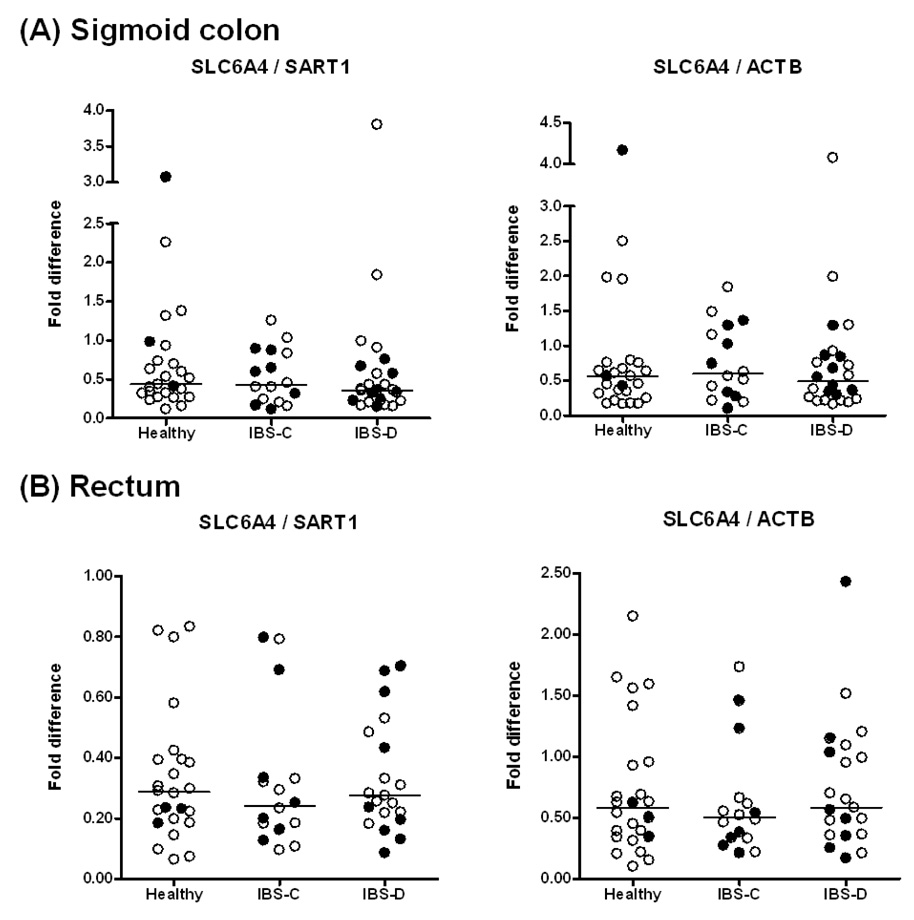
Figure 1.

Relative SLC6A4 mRNA expression in mucosal biopsies from (A) sigmoid colon and (B) rectum in healthy controls, IBS-D and IBS-C patients. Filled circles refer to participants receiving antidepressant medications. Data are expressed relative to the control genes SART1 (left) and ACTB (right). For sigmoid colon, data points represent the average value of two samples per subject. Median values per group are shown as horizontal lines.
