
Figure 4.
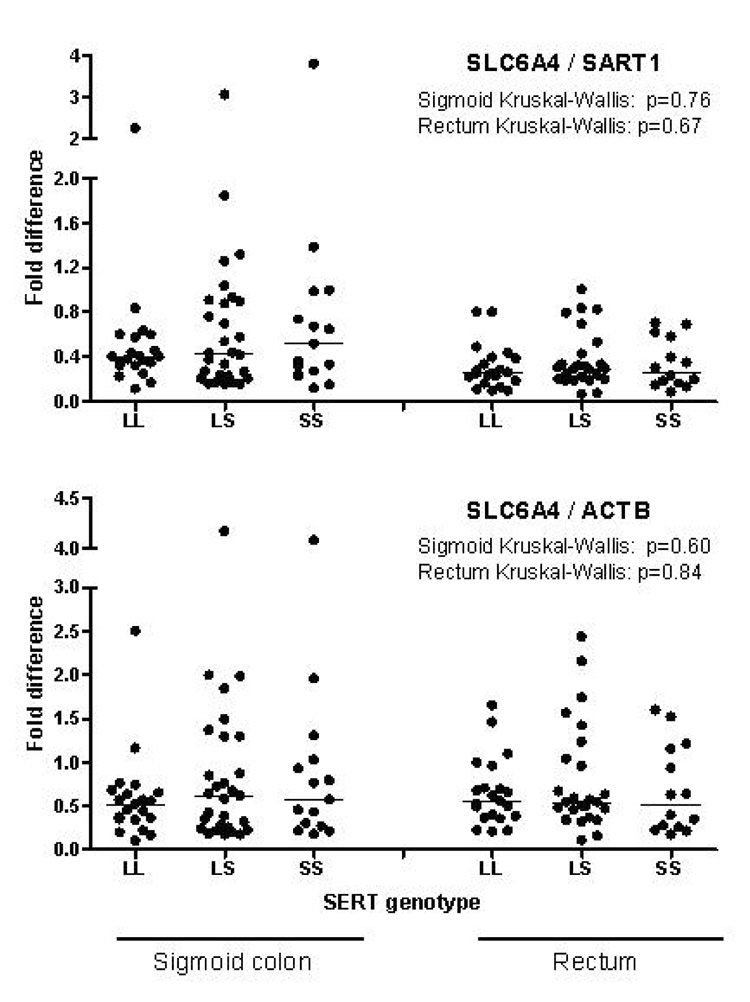
Comparison of mucosal SLC6A4 mRNA expression between SLC6A4 promoter genotypes. Data of SLC6A4 mRNA are expressed in relation to the control genes SART1 (upper panel) and ACTB (lower panel). Results from sigmoid and rectal biopsies are shown on the left and right, respectively. Horizontal lines represent medians.