
Figure 5.
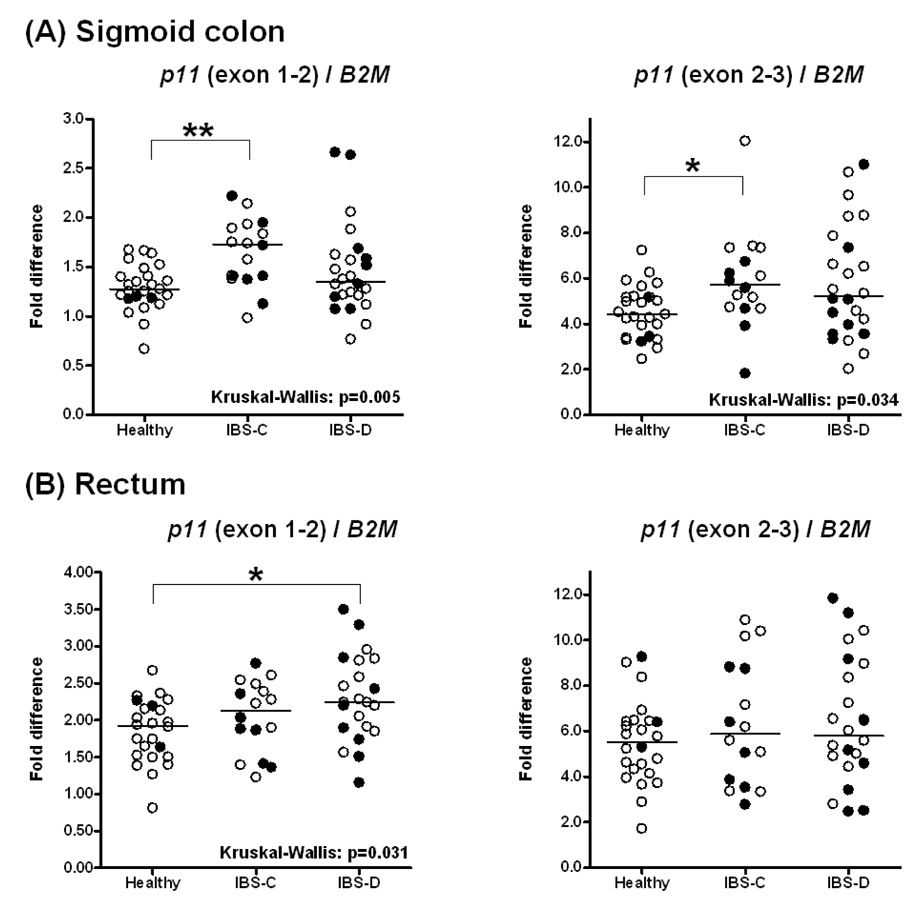
S100A10 (p11) mRNA expression in mucosal biopsies from (A) sigmoid colon and (B) rectum in healthy controls and IBS-D and IBS-C patients based on two different RTQ-PCR TaqMan assays (p11 exon 1–2 and p11 exon 2–3). Filled circles refer to participants receiving antidepressant medications. Data are expressed relative to the control gene B2M. For sigmoid colon, data points represent the average value of two samples per subject. Median values per group are shown as horizontal lines. Asterisks represent p-values <0.05 (*) or <0.01 (**) in two-group comparisons following significant Kruskal-Wallis tests.