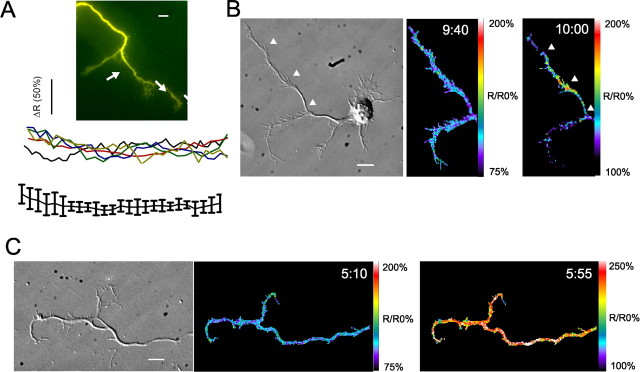
Figure 2.
Ratiometric imaging controls for differences in cell volume over time and reveals that amplitudes of global calcium transients are larger than those of localized calcium transients. A, Overlay of Fluo-4 (green) and volumetric marker Calcein Red/Orange (red) fluorescence shows uniform loading of both dyes (top). Arrows indicate regions through the axon from which line scans were obtained. Linescans through axonal processes of five neurons (shown below in different colors) during 5 min periods when calcium activity did not change showed that the ratio of fluorescence intensities over the entire axonal process remained constant. B, DIC image (left) and corresponding ratiometric images of calcium activity (R/R0, middle, right) of a cortical neuron at rest (middle, 9:40) and later exhibiting a localized calcium transient (right, 10:00). Arrowheads indicate corresponding positions on DIC and fluorescence images. The pseudocolor calibration bars are shown at right. C, DIC image (left) and ratiometric images of calcium activity (R/R0, right) of a cortical neuron at rest (middle, 5:10) and later exhibiting a global calcium transient (right, 5:55). Scale bars, 10 μm.

