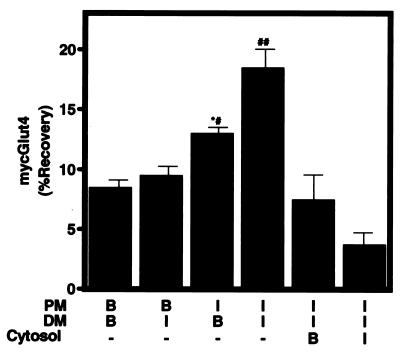
Figure 7.
Effect of insulin on the membrane components and cytosol. Donor membranes were prepared from 3T3-L1 adipocytes expressing mycGlut4 treated with or without 10−7 M insulin for 2.5 min. The PM and the cytosol were prepared from nontransfected 3T3-L1 adipocytes treated with or without 10−7 M insulin for 5 min (B, basal; I, insulin-stimulated). Reactions were performed as in Fig. 3. Results are expressed as the percentage of total mycGlut4 in the assay (n = 5, means ± SEM). Statistical significance was determined for pairwise comparisons within each experiment: *, P < 0.01 compared with BPM + BDM; #, P < 0.05 compared with BPM + IDM; and ##, P < 0.05 compared with BPM + BDM, BPM + IDM, and IPM + BDM.

