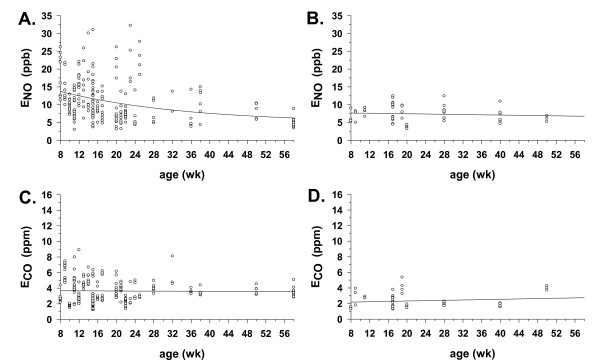
Figure 4.
ENO and ECO as a function of age. A. ENO with age in IL-10-/- mice (n = 234) from 8–58 weeks of age. Line indicates best-fit exponential decay regression curve (P < 0.05), calculated as described in the Methods section. Calculated regression equation was: y = 5 + 12 e-0.04x, with r2 = 0.11, and y-intercept (ENO) = 13.8 ppb at 8 weeks of age. B. ENO with age in C57Bl6 mice (n = 51) from 8–50 weeks of age, with abscissa lengthened to 58 weeks for comparison with IL-10-/- mice in panel A. Line indicates best-fit linear regression curve, calculated as described in the Methods section. Calculated regression equation was: y = - 0.02x + 7.8, with r2 = 0.01, and y-intercept (ENO) = 7.7 ppb at 8 weeks of age. C. ECO with age in same IL-10-/- mice as in panel A. Calculated regression equation was: y = - 0.002x + 3.7, with r2 = 0.0002, and y-intercept (ECO) = 3.7 ppb at 8 weeks of age. D. ECO with age in same C57Bl6 mice as in panel B. Calculated regression equation was: y = 0.0112x + 2.1, with r2 = 0.02, and y-intercept (ECO) = 2.2 ppb at 8 weeks of age.

