Figure 4.
Comparison of the pattern of labeled DNLL projections to the contralateral IC in control and bilateral ablation cases
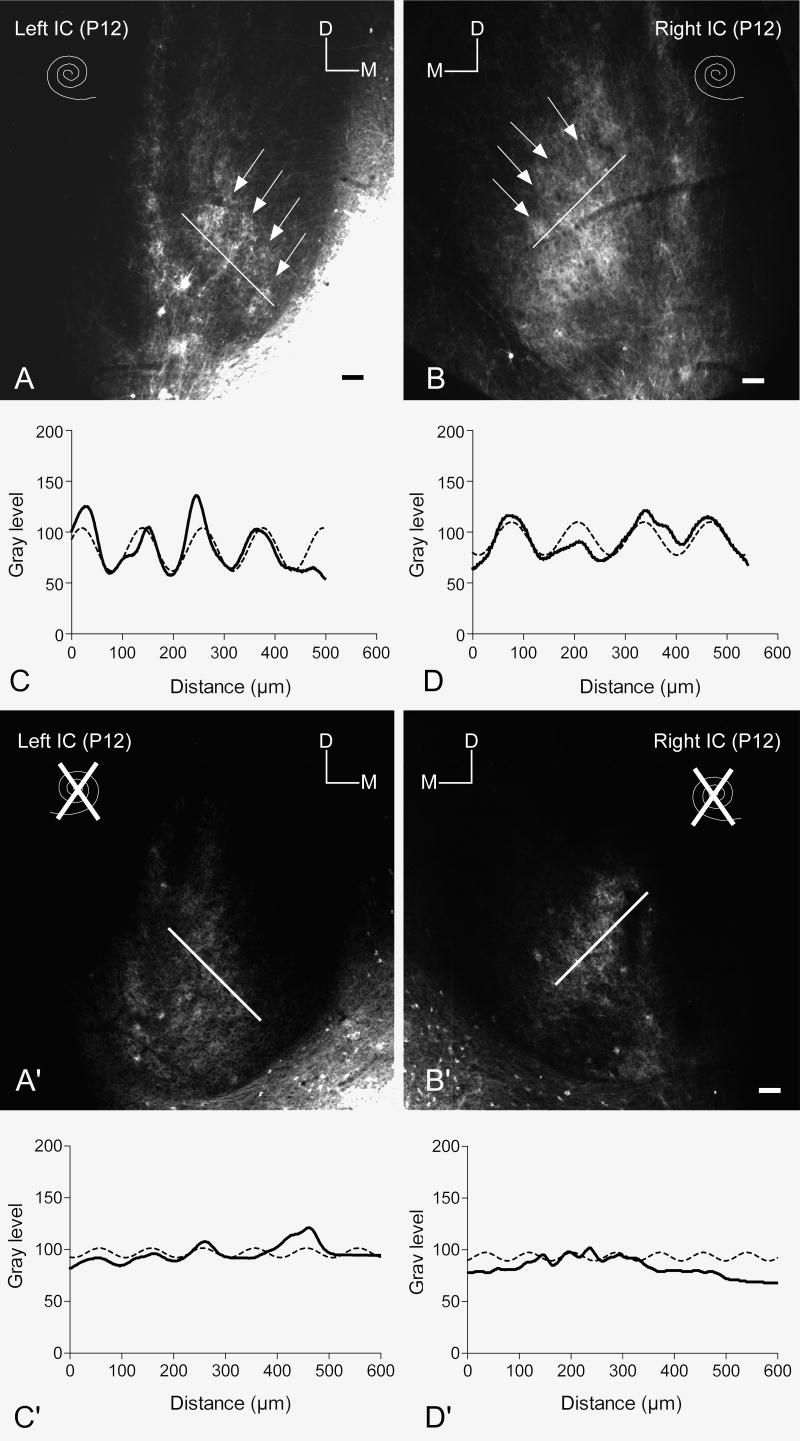
A, B. Paired images illustrating the symmetrical density and pattern of DiI labeled DNLL axons and endings distributed in the IC on each side in a P12 rat pup from the control group (intact condition of the cochleas indicated by the spiral symbols). Bright fluorescent labeling is segregated along bands in the central nucleus at the arrows. Markers indicate dorsal (D) and medial (M) orientation of the images. The bright region in the lower right corner of image A is spread the DiI pin. Scale bars equal 100 μm.
C, D. Line graphs illustrating regularly spaced changes in gray level along the white lines in images A and B from the left and right IC, respectively. Peaks in the line density plot (bold line) indicate the position of bright bands (arrows) in the corresponding images. Note the ‘fit’ of the best fit sine curves (dashed lines) to the density data.
A′, B′. Paired images illustrating the density and pattern of DiI labeled DNLL axons and endings distributed in the IC on each side in a P12 rat pup from the ablation group (condition of the cochleas indicated by the spiral symbols). Bright fluorescent labeling is segregated is distributed more uniformly in the central nucleus of IC compared to the distribution in the control group shown (A and B). Markers indicate dorsal (D) and medial (M) orientation of the images. Scale bars equal 100 μm.
C′, D′. Line graphs illustrating changes in gray level along the white lines in images A′ and B′ from the left and right IC, respectively. Peaks in the line density plot (bold line) are not at all as prominent as in the control group (A and B). The amplitude of the best fit sine curves (dashed lines) also is small compared to the controls.

