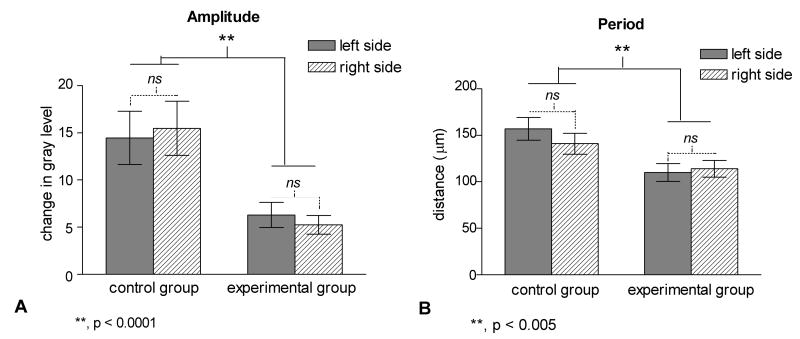
Figure 5.
Bar graphs comparing data from the control and ablation groups for the mean amplitude (A) and period (B) of fluctuation of gray level across the cochleotopic axis in the region of labeled DNLL projections of the left (solid bar) and right IC (hatched bar). Note that condition has a significant effect (control versus ablation), but side (left versus right) has no effect for either dependent variable.

