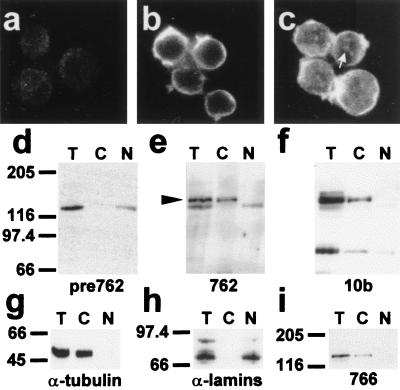
Figure 5.
Intracellular distribution of endogenous immunoreactive HMW 4.1R proteins in MOLT-4 T-cells. Immunofluorescence microscopy of MOLT-4 T-cells probed with preimmune serum for antibody 762 (a), antibody 762 (b) and antibody 10b (c). The white arrow indicates the dot-like staining pattern detected with 10b antibody within the nucleus. (d–i) Western blot analysis of MOLT-4 subcellular fractions isolated as described in Materials and Methods (equivalent cell volumes were loaded in each lane; T, total cell extracts; C, cytoplasm or nonnuclear fractions; N, nuclear fractions). The antibodies used were: preimmune serum for antibody 762 (d), antibody 762 (e), antibody 10b (f), antitubulin antibody (g), antilamins (h), and antibody 766. The black arrowhead indicates the specific ≈145-kDa band fractionating to the nonnuclear fraction that is recognized by antibody 762. This band is also recognized by antibodies 10b and 766.

