Figure 4.
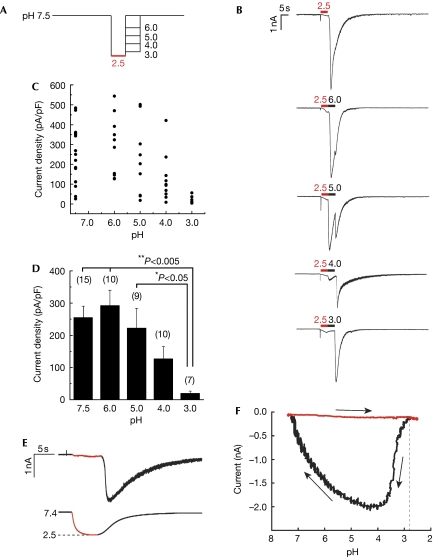
pH dependency of PKD1L3–PKD2L1 channel activation after acid exposure. (A) Cells expressing PKD1L3–PKD2L1 channels were exposed to an acid at pH 2.5 for 5 s and then to solutions at various pH values (3.0, 4.0, 5.0, 6.0 or 7.5) for 5 s each toward neutralization (pH 7.5). (B) Representative whole-cell current profiles obtained by the protocol described in (A). Red and black bars represent treatment with the acid at pH 2.5 and with solutions at various pH values, respectively. (C) Distribution and (D) average of the current densities induced by treatment with the second solutions at various pH values. Error bars and values in parentheses indicate the s.e.m. and number of cells, respectively. (E) A representative citric acid-induced current (upper) with corresponding pH (bottom). Red parts indicate a current during the acid application. (F) A representative pH-response profile made from traces in (E). The red part indicates acid application shown in (E). Arrows indicate time course of current–pH relationship.

