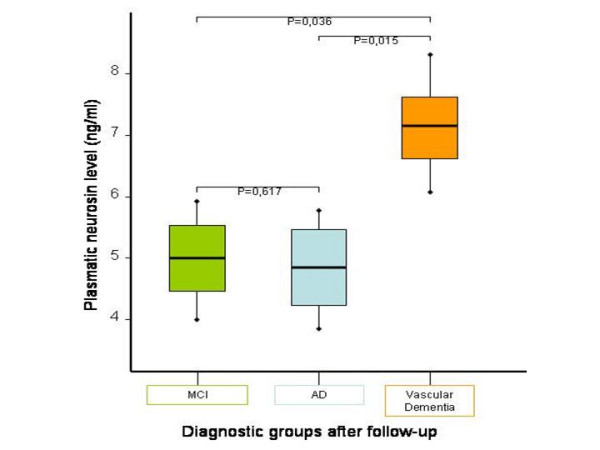
Figure 1.

Differences in plasmatic level of neurosin between the three diagnostic groups after follow up. The plasmatic neurosin concentration is shown for the three final diagnostic groups (MCI in green, AD in blue and Dementia with vascular component in brown). Statistical differences were found between Dementia with vascular component and both AD and MCI.
