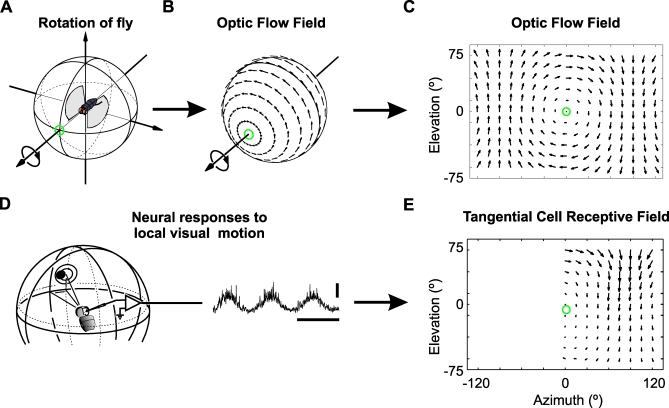
Figure 1. Receptive Field Maps of LPTCs Are Similar to Optic Flow.
The optic flow field resulting from roll-rotation to the left (A) is plotted on the visual unit-sphere surrounding the fly (B) and in a 2D cylindrical projection (C). The orientation and length of each arrow indicates the direction and magnitude of local retinal image shifts at different positions within the spherical visual field.
(D) A small dot traveling on a circular path is used to characterize a LPTC's response to local motion at different positions in the fly's visual field. The response of the directional selective neuron is modulated by the changes of the dot's directional motion (for further details see [40] and Materials and Methods section). horizontal scale bar: 500 ms, vertical scale bar: 10 mV.
(E) Part of the receptive field map of the tangential cell VS6 as obtained by Krapp et al. [17] using the experimental procedure shown in (D). The orientation and length of the arrows indicate the local preferred direction and relative motion sensitivity at the respective position within the cell's receptive field. The green circle marks the approximate position of the cell's preferred axis of rotation. Note that the cell's local preferred directions are oriented along concentric circles centered on the preferred axis in a manner reminiscent of the motion vectors in a roll flow field (C) and (E).

