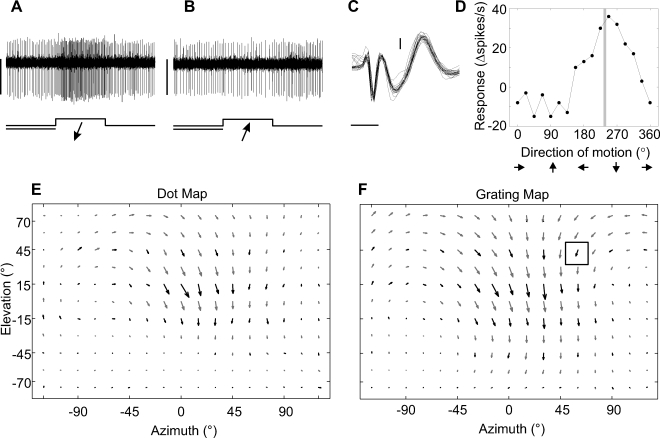
Figure 2. Characterizing the Visual Receptive Field of a NMN in the Left CN.
The responses of the NMN are shown to oblique downward (A) and upward (B) motion of a grating moving perpendicular to its orientation at 60° azimuth and 45° elevation. The bottom traces and arrows give the time courses and directions of the visual stimuli, respectively. In (A) and (B), horizontal scale bar: 1 s, vertical scale bar: 0.05 mV.
(C) Extracellular hook electrode recording from a neck muscle close to the neck motor neuron, different from those shown in (A) and (B). Threshold-triggered waveforms are overlaid to show the 1:1 correspondence between a low-latency sharp waveform, most likely the neck motor neuron action potential, and the subsequent longer-latency wide waveform, most likely the muscle potential of the innervated muscle. Horizontal scale bar: 1 ms, vertical scale bar: 0.2 mV.
(D) Directional tuning curve of the same cell for which individual recording traces are shown in (A) and (B). The vertical gray line indicates the local preferred direction defined by the phase of the first harmonic obtained from the tuning curve's Fourier transform.
(E) and (F) Maps of the local preferred directions and motion sensitivities obtained at many different positions with the “dot method” (Figure 1D) and the “grating method”. The boxed arrow in (F) is derived from the directional tuning curve in (D). Black arrows indicate experimental results; grey arrows were obtained by interpolation (see Materials and Methods section for further explanation).

