
Fig. 4.
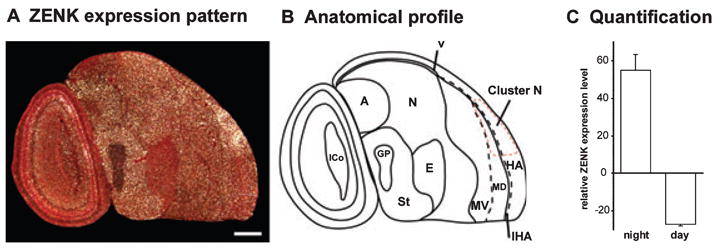
ZENK expression in Sardinian warblers. (A) Darkfield image of ZENK expression in a sagittal section showing Cluster N. Rostral is right, dorsal is up. (B) Anatomical profile of the image shown in (A). The red dashed line marks the boundary of Cluster N. (C) Quantification of ZENK expression levels in Cluster N, comparing day-time and night-time groups. For abbreviations see Fig. 1 legend. Error bars are SEM. Scale bar, 1 mm.