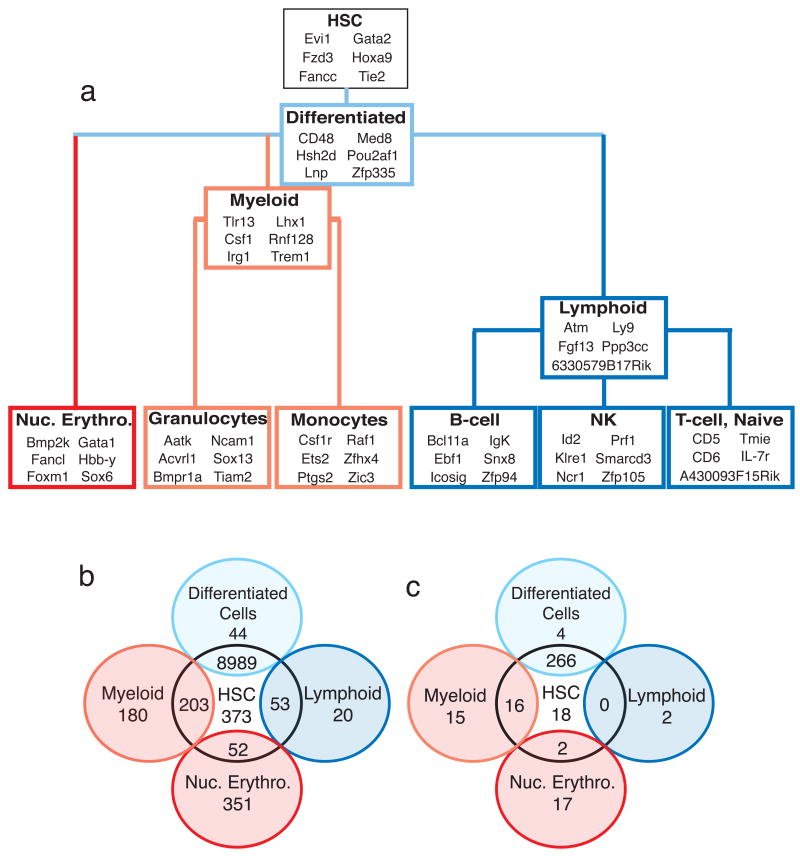
Figure 3. Examples of fingerprint genes and phenotype assessment.
(a) Selected genes from each of the cell-type and shared fingerprints are shown in context with their developmental relationships. (b) A Venn diagram summarizes the number of shared genes in the different fingerprints. (c) Venn diagram summarizes the number of knockout mice with hematopoietic phenotypes in each of the indicated gene groups. Not all cell types and intersections are shown.

