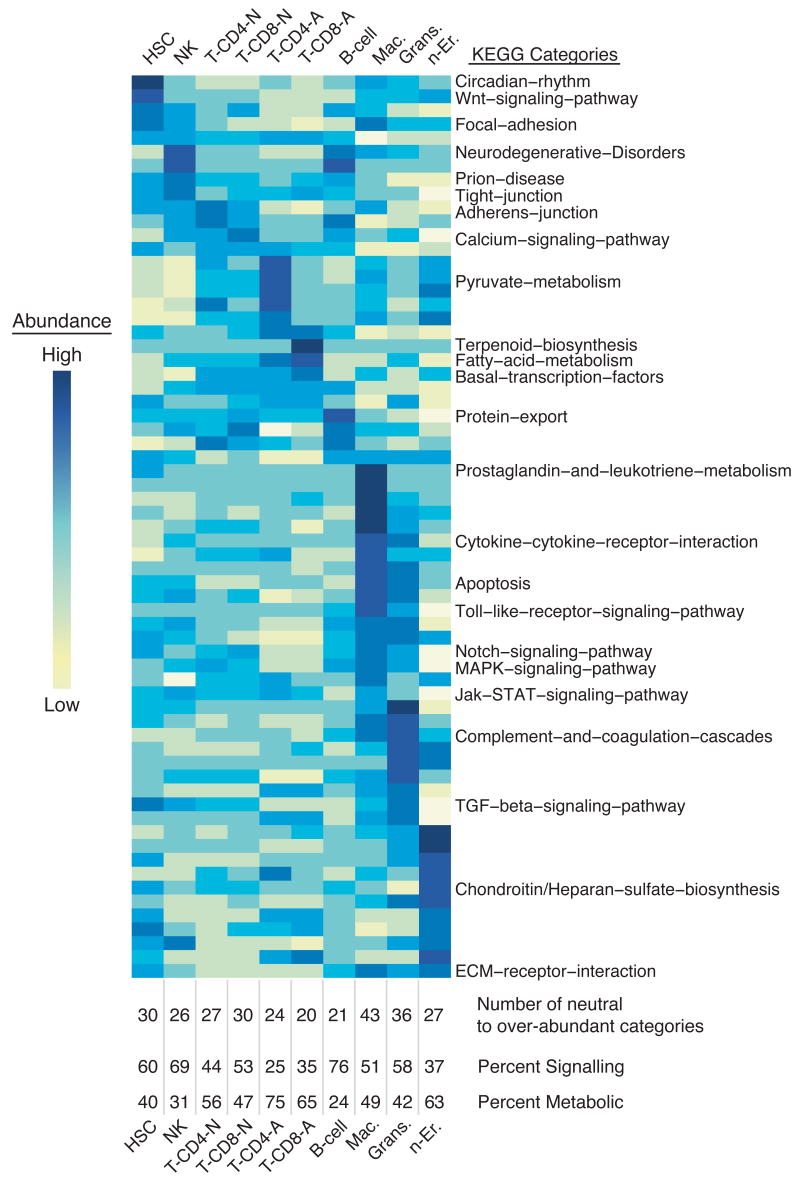
Figure 5. Molecular pathway analysis of hematopoietic cells using KEGG.
KEGG was used to identify which cell types exhibit an over- or under-abundance of components of a molecular pathways, with significant differences between cell types determined by an ANOVA (one way, α = 0.05). For pathways containing genes found on the array, the mean expression value for all genes within a pathway for each cell type is displayed as a function of color (yellow corresponds to low average expression, dark blue to high). Pathways are ordered by high expression within a cell type from left to right. Below the heat map, the number of neutral to over-abundant categories is denoted, and the percent of those pathways that are signaling and metabolic is indicated. This method identified differences in KEGG pathway activity between the cell types; pathways equally active in all cell types will not appear significant.

