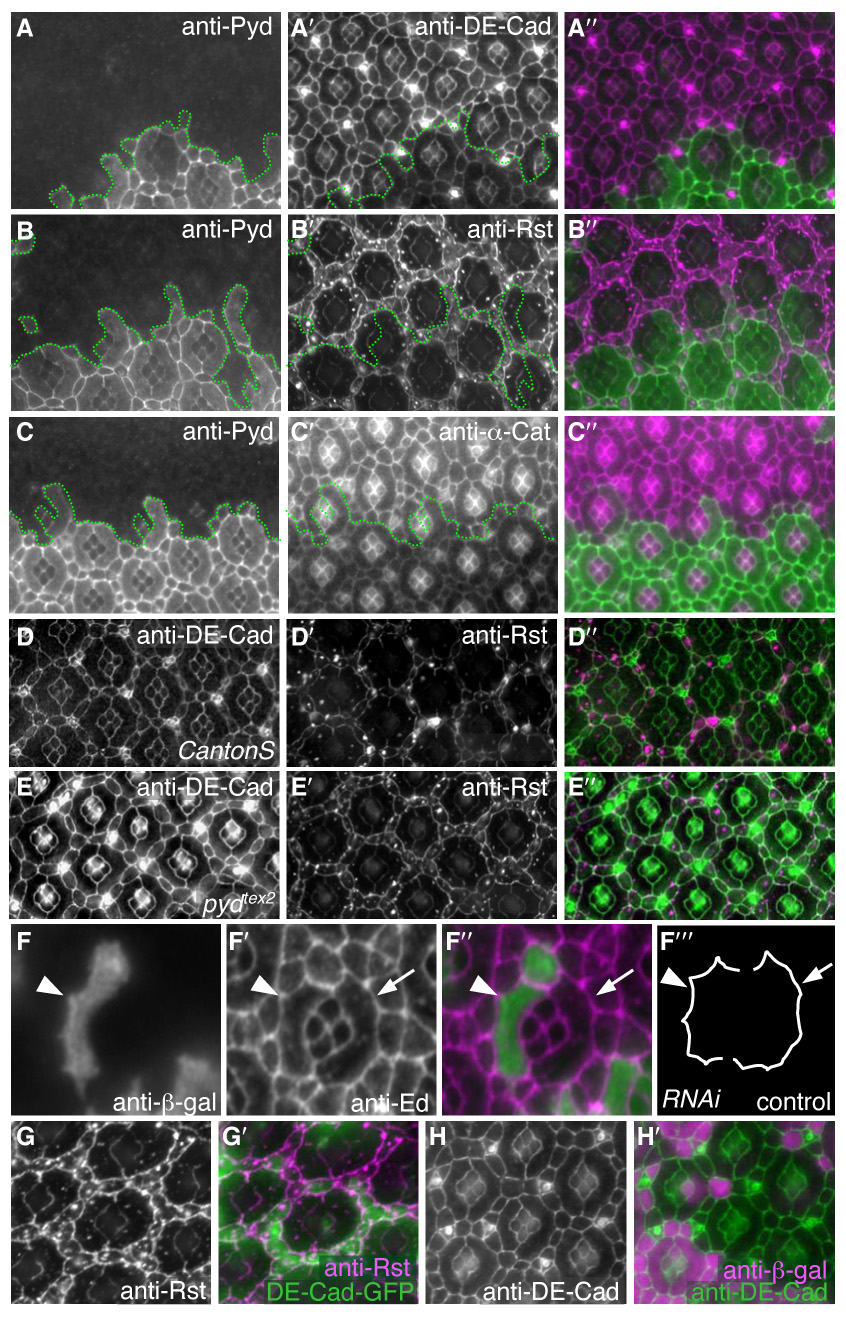
Fig 4.

Cells with reduced Pyd exhibited increased levels of core AJ proteins at the membrane. All images were taken at 28 hours APF. A–C″. pyd-RNAi expressing cells were marked by lack of anti-Pyd immunofluorescence (A, B, C). DE-Cad (A′), Rst (B′) and α-Cat (C′) levels were increased specifically at the apical membrane in cells expressing pyd-RNAi. Overlay in A″, B″ and C″, respectively. D–E″. Homozygous pydtex2 retinas also had increased levels of DE-Cad (E) and Rst (E′) – compare to wild type tissue (D and D′). Overlay in D″ and E″. F–F‴. Single 1° cell and IPC clones expressing pyd-RNAi were marked by β-gal expression (F). Anti-Echinoid (F′) outlines the cells (overlay in F″). Tracing of control and pyd-RNAi expressing cells (F‴) demonstrating that scalloping of the IPC/1° boundary (e.g., arrowhead) was increased when cells expressed pyd-RNAi. G–G′. DE-Cad-GFP over-expression in a patch of cells (green in G′) did not alter the localization or level of anti-Rst immunofluorescence (G and magenta in G″). H–H′. Rst over-expression in a patch of cells (marked by anti-β-gal; magenta in H′) did not alter the localization or level of anti-DE-Cad (green in H″).
