Fig. 8.

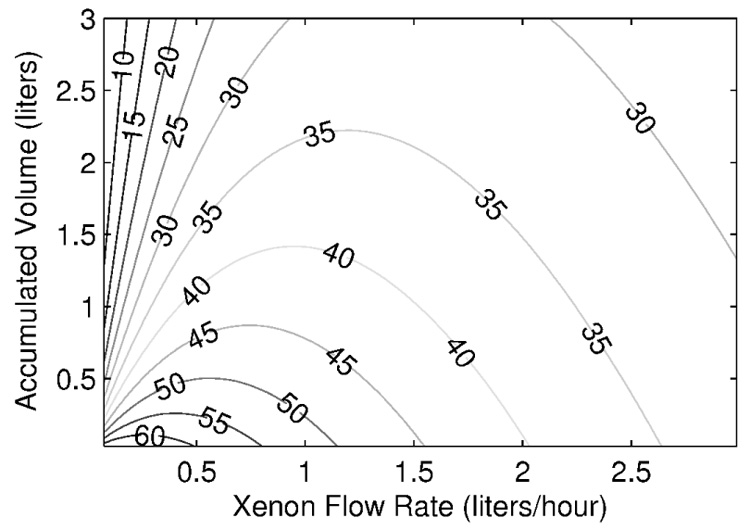
Polarized xenon production map considering a relaxation time in frozen state of 2.5 hours and no polarization loss during the freeze-thaw cycle. Numbers shown on the contour lines represent final polarization expressed in percent.

Polarized xenon production map considering a relaxation time in frozen state of 2.5 hours and no polarization loss during the freeze-thaw cycle. Numbers shown on the contour lines represent final polarization expressed in percent.