
Fig. 1.
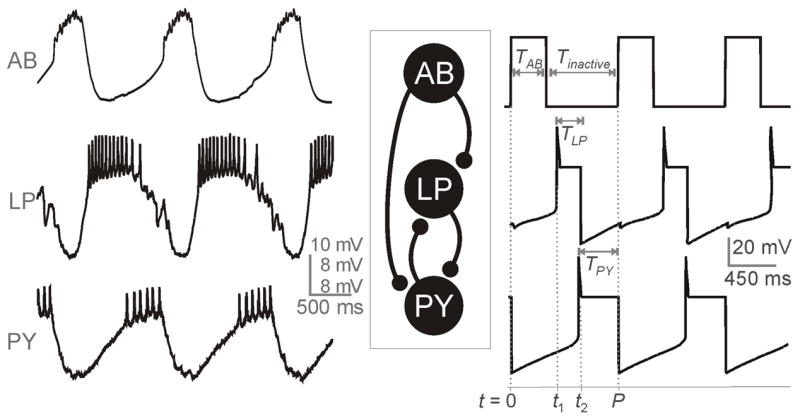
Voltage traces of a typical ongoing tri-phasic pyloric rhythmic activity involving the pacemaker neuron AB and follower neurons LP and PY. Left traces show experimental recordings (Nadim, unpublished data) and the traces on the right are the simulation of our model which provides an approximation to the envelope of oscillations observed in the experimental traces. The temporal parameters are marked in the model traces. The middle panel is a reduced schematic diagram of the pyloric network, showing the cells and synapses used in the model.