Fig. 5.

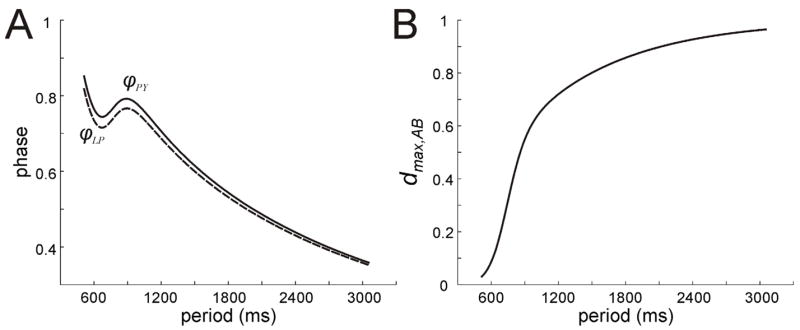
Behavior of LP and PY when only AB inhibition is present. A. Phase curves for LP and PY show a stereotypical cubic shape indicating that different mechanisms and parameters control phase at different periods. B. The value of dAB,max increases with period. The strengthening of the feed-forward AB synapses for P > 600 causes the control of phase (as shown in panel A) to switch from the LP and PY intrinsic mechanisms to the AB synapses.
