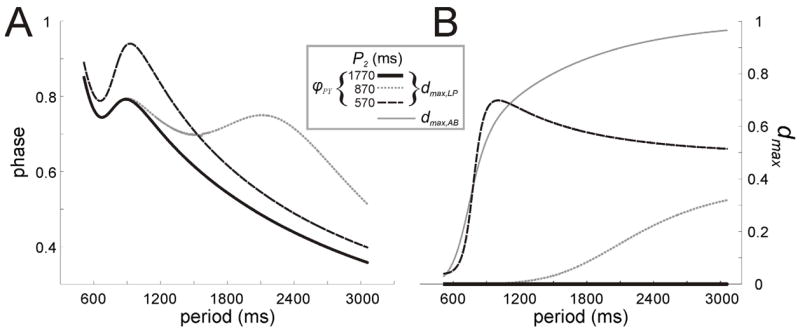
Fig. 6.

Behavior of PY under AB and LP inhibition. A. The PY phase curves shown in three conditions indicate how the half-activation period (P2) of the LP to PY synapse affects its ability to change the phase of PY. B. The behavior of dLP,max for the three cases shown in panel A. The value dAB,max (grey solid curve) is also shown to illustrate the relationship between the two synapses.
