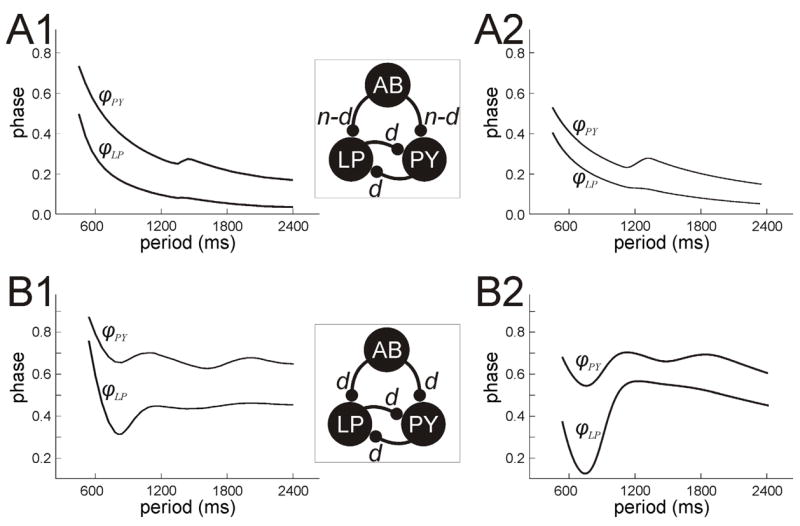
Fig. 9.

LP and PY phase curves when reciprocal inhibition between the two is present. A. When the AB synapses are non-depressing, the PY phase can still be better than 1/P if the LP inhibition to PY is depressing. The local maxima of ϕPY are due to the strengthening of the LP to PY synapse. Also note the small increase in ϕLP near these periods. B. When the AB synapses are depressing, ϕPY and ϕLP can both have multiple local extrema. Panels A1 and B1 were obtained by numerically solving the full set of equations for their respective cases. Panels A2 and B2, obtained by solving equations (25) and (26), show good qualitative agreement with these numerical results.
