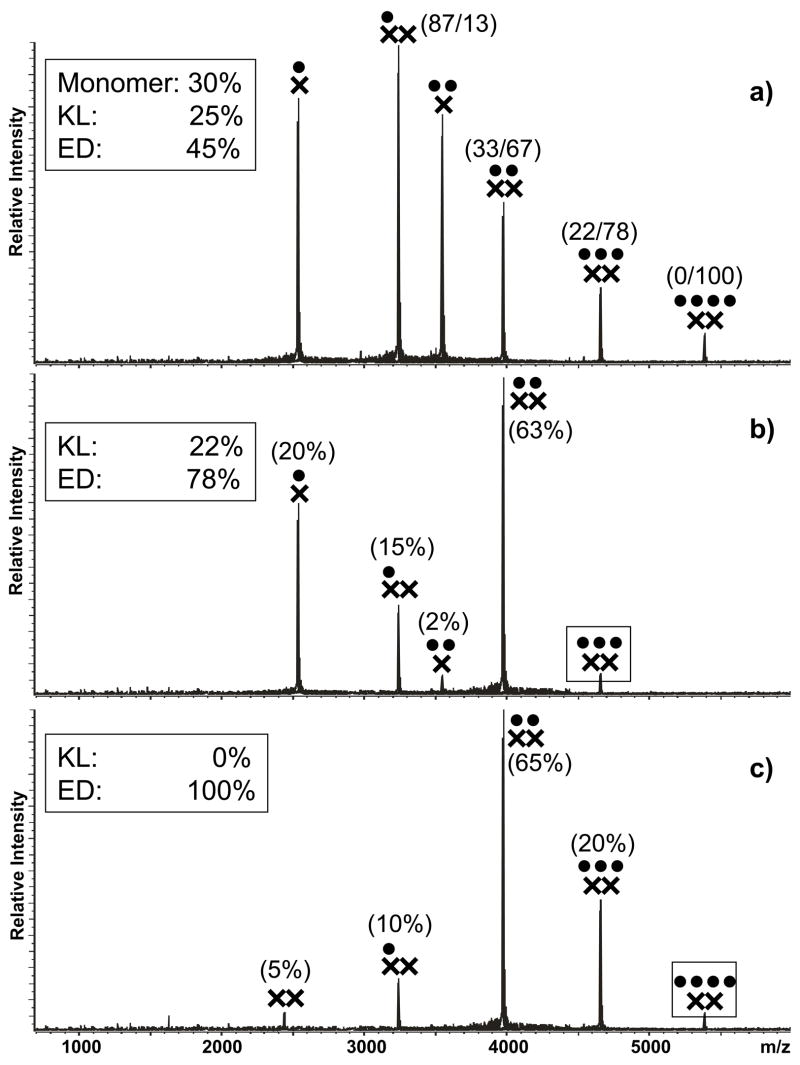
Figure 6.
a) Nanospray-FTICR mass spectrum of a sample containing 30 μM NC (●) and 10 μM wild-type SL1A (×) in 150 mM ammonium acetate (pH 7.0) after 3 hour incubation at 37°C. Panel b) and c) include the product ion spectra obtained by submitting the 3:2 and 4:2 complexes to mild SORI-CID (see Materials and Methods). Boxed symbols identify each precursor ion. In panel b) and c), the percentages in parentheses indicate the normalized intensity of the corresponding signal compared to the total intensity of the product species, as described in Materials and Methods. Dimeric products were assigned to the ED conformer, whereas monomeric products were assigned to KL. The percentages were then summed to determine the partitioning between the two conformers within each precursor ion population, as reported in the box. In panel a), the KL/ED proportions within each ion signal were used to obtain the overall proportions of monomeric, KL, and ED forms in solution (summarized in Table 2).

