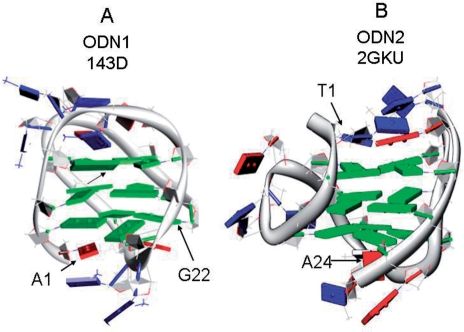
Figure 1.
Cartoon showing the folding topology of ODN1 in Na+ [G3(T2AG3)3, PDB id 143D, (A)] and ODN1 [T2G3(T2AG3)3A, PDB id 2GKU] in K+ (B). Bases are shown as slabs in which blue, T; red, A; green, G. The figures were drawn using the molecular graphics program Chimera (65) from NMR-derived coordinates for the first conformer listed in pdb files 143D (24) and 2GKU (28).

