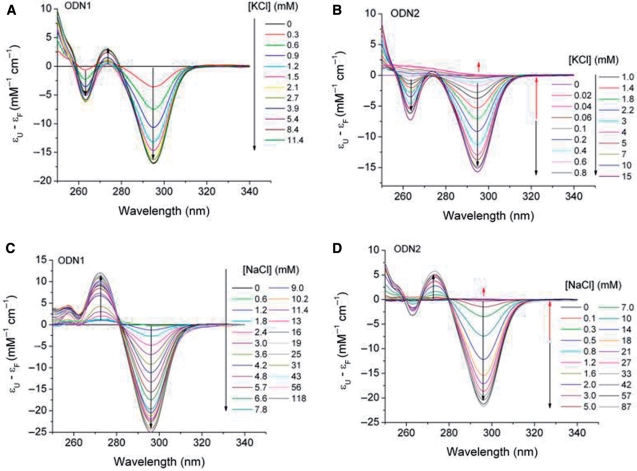
Figure 2.
Spectrophotometric titrations of oligonucleotide models of the human telomeric sequence X-G3(T2AG3)3-Y. In (A and C), ODN1 (X = T, Y = 0) was titrated with KCl or NaCl, respectively. In (B and D), ODN2 (X = TT, Y = A) was titrated with KCl or NaCl, respectively. The arrows in the figures indicate decreasing or increasing absorbance changes with successive additions of cation. The final cation concentrations after each addition are shown at the right in each panel. Difference spectra are presented as the difference between the absorption coefficients ε for the unfolded (U) and the folded (F) structures. Oligonucleotide strand concentrations were 4–6 µM in folding buffer (10 mM tetrabutylammonium phosphate, 1 mM EDTA, pH 6.97). The temperature was 25°C.

