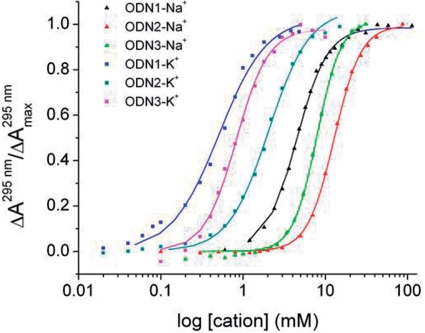
Figure 3.
Fraction of folded oligonucleotide (α) as a function of added cation. The points were derived from the absorbance changes at 295 nm shown in Figure 2 for ODN1 and ODN2. For ODN3, the points are from spectra in Figure S1. The lines were derived by fitting the points to the Hill equation as described in the text. The resulting optimal fitting parameters n (Hill coefficient) and K0.5 (cation concentration at half the saturation) are summarized in Table 1.

