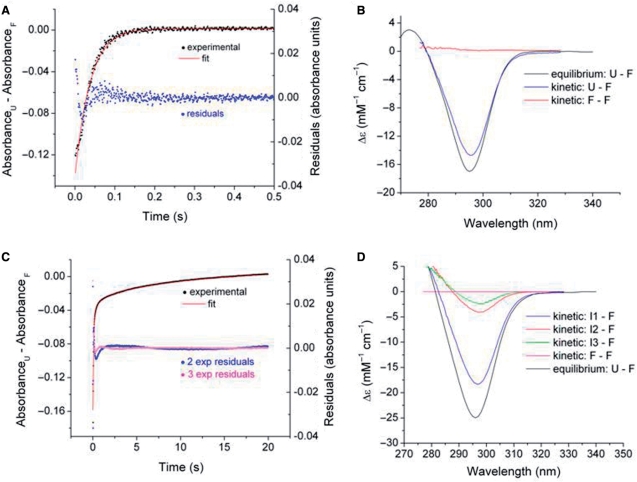
Figure 5.
SVD and nonlinear least squares analysis for K+- and Na+-induced folding of ODN1 (data sets of Figure 4). Panels A anc C compare experimental progress curves at 295 nm to simulated curves generated by global fitting of the wavelength–time courses data matrix to a single exponential process for K+ (A) folding and triple exponential processes Na+ folding of ODN1 (C). The optimal rate constants are given in the text. The residual plots (A and C) indicate the deviations of the experimental and fitted absorbance changes. The kinetic and static difference spectra are compared in (B) for K+-driven folding and in (D) for Na+-driven folding. The equilibrium difference spectra are taken from the titration data of Figure 2 and the kinetic difference spectra were derived by SVD and least square fitting procedures as described in the text. The Δɛ values are derived with reference to the fully folded structure.

