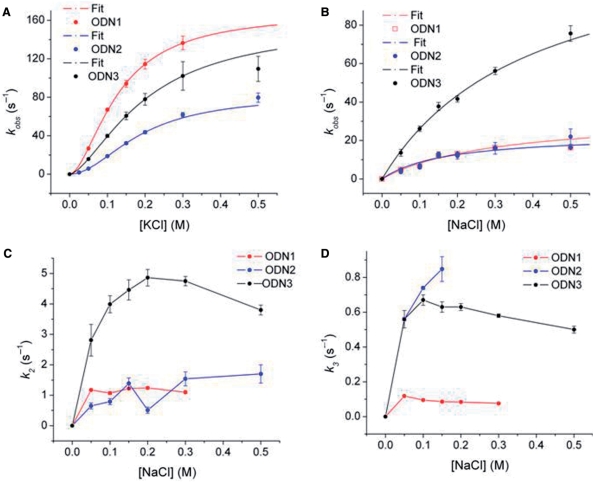
Figure 6.
Dependence of the rate constants for oligonucleotide folding on cation concentration. (A) Shows sigmoidal dependence of kobs on [KCl] for ODN1, ODN2 and ODN3. The lines illustrate the best fit of the data to Equation 4 determined by nonlinear least squares analysis. The line was calculated using the optimal values for n, k2 and K in Table 2. (B) Shows a similar fit on [NaCl] of the fastest rate constant for ODN1, ODN2 and ODN3 folding. The lines represent the dependence of kobs on [NaCl] calculated using the optimal values of k2 and K in Table 2. (C and D) Show the dependence of the rate constants for the slower relaxations (k3 and k4) on [NaCl]. The lines connect the data points but have no theoretical basis. The error bars represent the SD of the fitted parameter.

