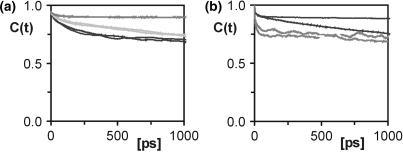
Figure 2.
Correlation functions of cytosines compared to other residues. (a) The correlation functions of the C1′–H1′ vector of residues C3 (black), A5 (dark grey) and C9 (light grey). (b) Correlation functions of the non-converged residues A6 (black) and T7 (dark grey). Two correlation functions are given for each vector, one for each of the symmetry-related strands of the palindromic dodecamer.

