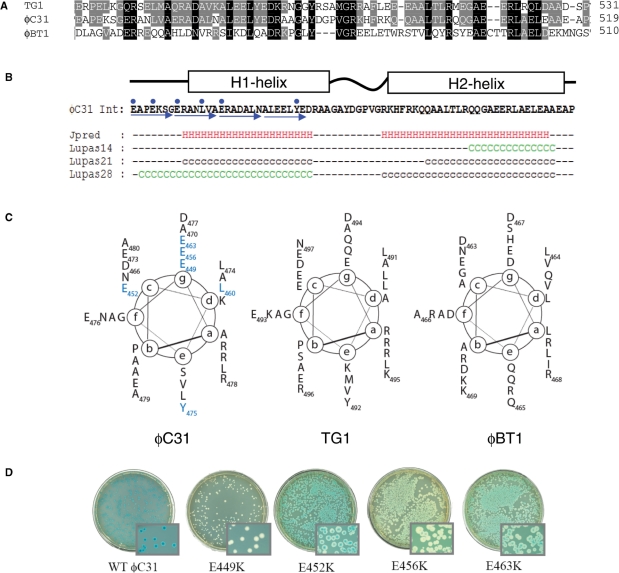
Figure 4.
Structure prediction for the hyperactive region of ϕC31 integrase. (A) An alignment of the sequences of the most similar homologues to ϕC31 integrase (ϕBT1 and TG1 integrases) is shown with the residues conserved between all three proteins shaded black and between two shaded grey. (B) The output from JPRED and COILS predictions are shown below the sequence of the hyperactive region from ϕC31 integrase (41,42). The blue arrows show the heptad repeat and the blue dots are the positions of the mutations conferring hyperactivity. H indicates a residue in a predicted α-helix, C (green) and c (black) indicate residues with coiled-coil forming probability of >90% and between 50% and 90%, respectively. (C) Helical wheel representations of the hyperactive region of ϕC31 integrase and comparable regions from TG1 and ϕBT1 integrases. The (a)–(g) are the positions of amino acids in the heptad repeat. The residues that confer hyperactivity are in blue. (D) Activities of wt and hyperactive integrases in the in vivo recombination assay using pPAR1000 as a reporter of attL x attR recombination. Blue colonies indicate no recombination. White, light blue or sectored colonies indicate recombination between attL x attR to excise the lacZ gene.

