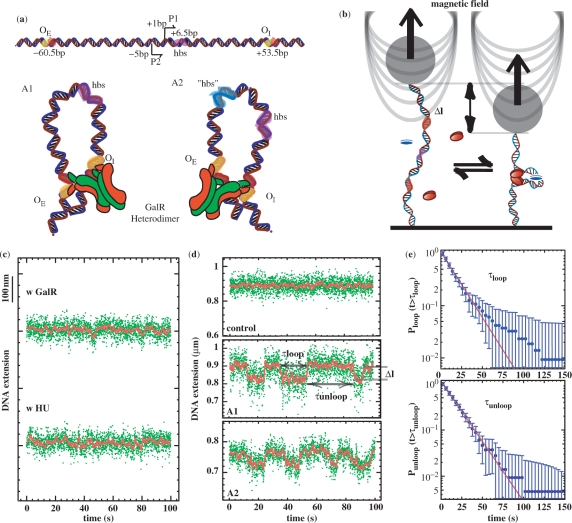
Figure 1.
Loop formation by the GalR and HU proteins on supercoiled DNA. (a, top) Graphic representation of the gal regulatory region. Top, the two promoters, P1 and P2, are flanked by the gal operators, OE and OI. Using the transcriptional start site of the P1 promoter as a reference for numbering, the HU-Binding Site (hbs) is located downstream of the promoters, at position +6.5 (42) in A1. For the A1 and A2 constructs, functional GalR tetramerization interfaces are marked in green; the inactivated ones are marked red. Arrowheads indicate directions of transcription. (a, bottom) GalR heterodimer-mediated A1 and A2 DNA loops. The major difference between the two trajectories results from the interaction of the operator-bound dimers. As a consequence of the 60° angle between the two dimers in the GalR tetramer, the DNA is thought to be unwound with respect to relaxed DNA in both antiparallel conformations (8). The site for HU binding in the A1 construct is colored pink. The putative site for HU binding “hbs” in the A2 construct is colored blue (see Discussion section). (b) Scheme of the experimental set-up. A single DNA molecule containing the GalR and HU-binding sites is anchored at one end to the glass surface and at the other end to a paramagnetic bead. In response to small magnets placed above the sample, the bead can be used to stretch and twist the DNA. Loop formation by GalR (red ovals) and HU (blue oval) reduces the extension by an amount, Δl. (c) Control experiments performed in the presence of only GalR or only HU. (d, top) Typical signal from an A1 DNA molecule in the absence of proteins. This is indistinguishable from that of an A2 DNA molecule. (d, center and bottom) Typical telegraph-like signal observed for A1 or A2 DNA molecules, respectively, at 0.9 pN in the presence of proteins. The green dots are raw data and the red line is the averaged signal (1 s). In all experiments, molecules were unwound by 3% (σ = −0.03). From the trace, it is possible to measure the transition time (τloop and τunloop) between the looped and unlooped state, as well the loop size. (e) Cumulative probability distribution of τloop and τunloop for all the transitions observed at 0.9 pN in the A1 DNA (error bars are statistical errors). The distributions are fitted by a single exponential giving a mean lifetime: <τloop> = 17.3 ± 1.3 s and <τunloop> = 16.7 ± 0.9 s.

