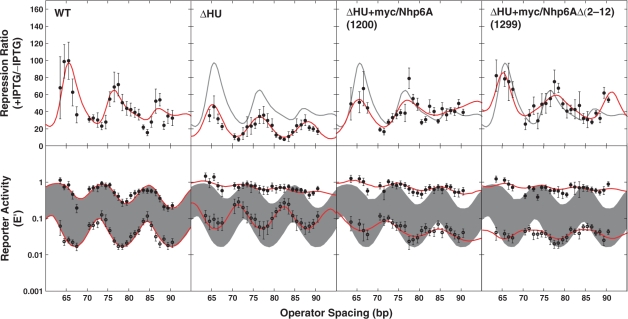
Figure 3.
DNA looping in vivo. Top row: the repression ratio (ratio of β-galactosidase activity under inducing versus noninducing conditions) is shown for E. coli WT, ΔHU and ΔHU strains expressing heterologous HMGB proteins. WT behavior is indicated by a shaded line in the three columns to the right. Bottom row: β-galactosidase activity normalized to controls lacking an upstream operator under inducing (upper curves: filled circles) or noninducing (lower curves: open circles) conditions. Error bars represent standard deviations based on replicate measurements. Curve fitting to the thermodynamic model is shown. Shading indicates uninduced and induced reporter expression from WT cells. Raw data are available at NAR Online.

