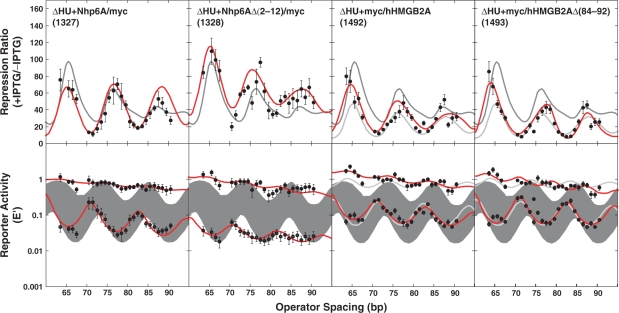
Figure 4.
DNA looping in vivo. The repression ratio and normalized activities are shown as in Figure 3 for additional tested strains. In columns three and four, light colored curves show ΔHU behavior for comparison. Considering length dependence explicitly clearly improves the fitting to the +IPTG E ′ data. Raw data are available at NAR Online.

