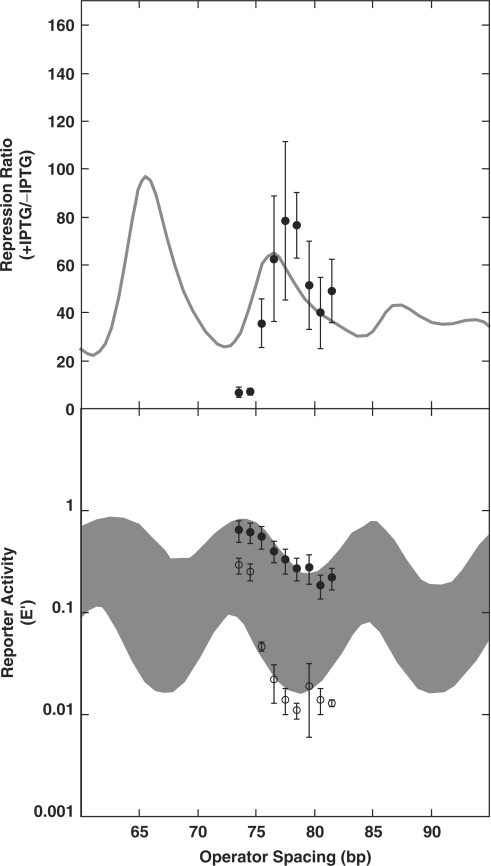
Figure 6.
Changing promoter/operator spacing does not alter optimal loop lengths for repression. Top: repression ratio for WT cells with spacing shown in (C) of Figure 5 (filled circles) versus spacing shown in (B) of Figure 5 (shaded line). Below: reporter gene expression E ′ levels for uninduced (open circles) and induced (filled circles) cells with the promoter/operator arrangements shown in Figure 5C versus those in Figure 5B (curves and filled region). Data are available at NAR Online.

