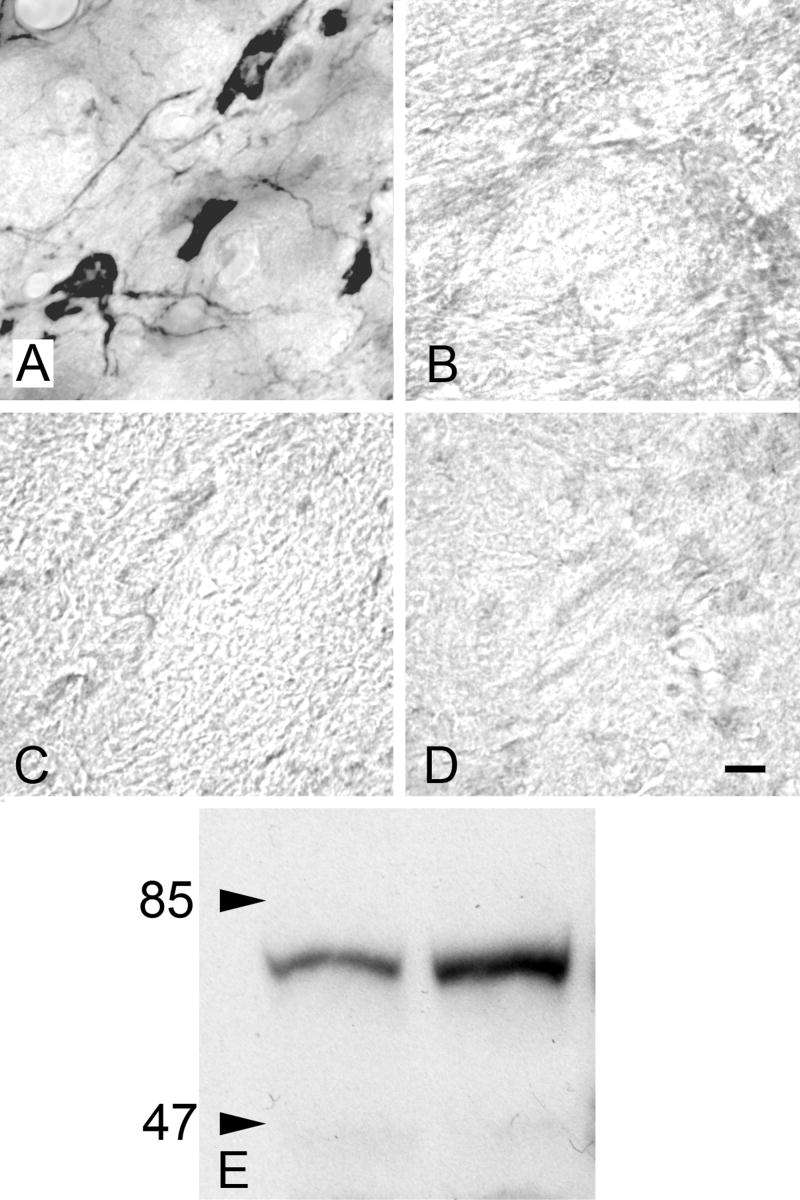
Figure 1.
Immunohistochemistry controls. A) ChAT-IR staining in the pedunculopontine tegmental (PPT) nucleus. Absence of staining is demonstrated with B) preabsorption, C) primary antibody omission, and D) secondary antibody omission controls in nearby sections from the same animal. All images are from the PPT. Scale bar = 10 μm for A-D. E) Western blot analysis of brain tissue with ChAT antibody (Chemicon AB144P). Left lane: brainstem. Right lane: thalamus and forebrain. In each lane a single band is present at the expected 68-70 kDa molecular weight.

