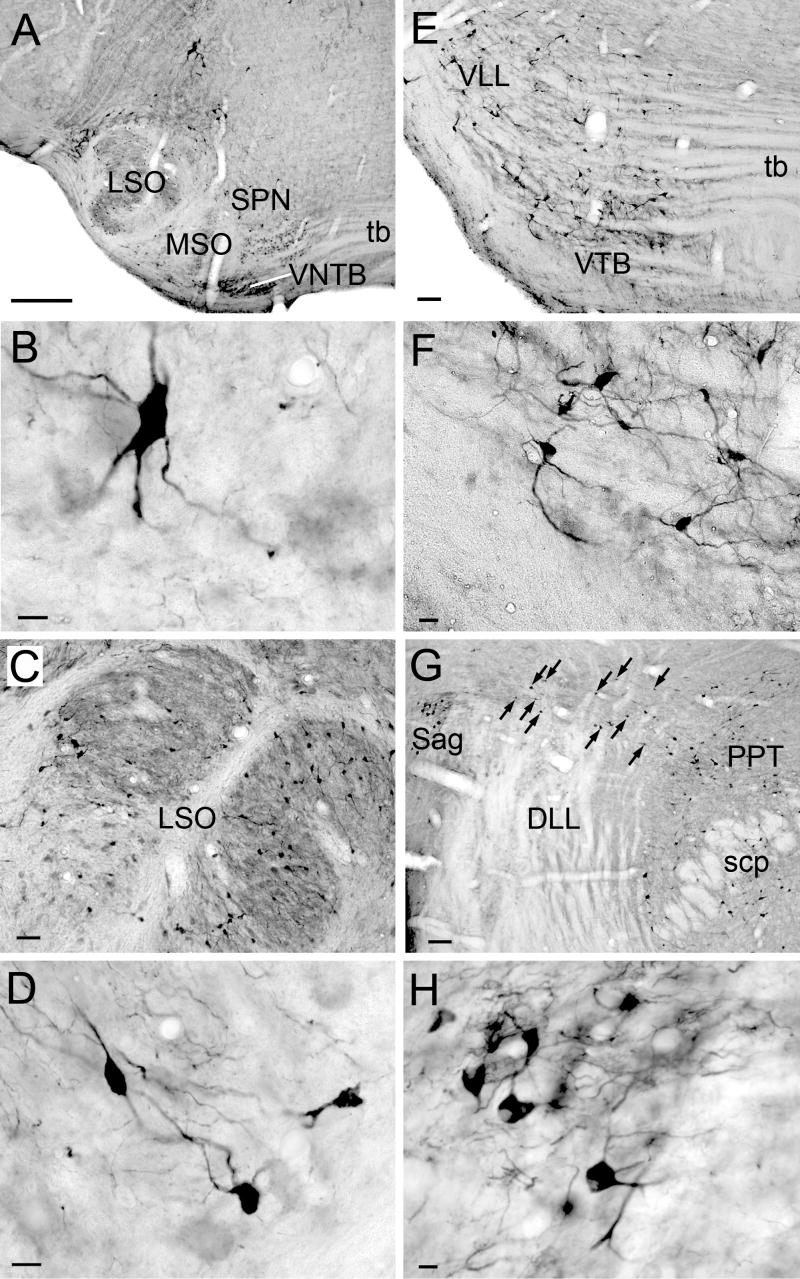
Figure 8.
Photomicrographs of ChAT-IR cells in auditory nuclei A) Major nuclei of the superior olivary complex: lateral superior olivary nucleus (LSO), medial nucleus of the trapezoid body (MTB), medial superior olivary nucleus (MSO), superior paraolivary nucleus (SPN), and ventral nucleus of the trapezoid body (VTB). B) SPN cell. C, D) LSO cells. E) VTB and ventral nucleus of lateral lemniscus. F) VTB cells. G) Cells in the sagulum (Sag) lateral to DLL, in the PPT medial to DLL, and forming a “bridge” (arrows) stretching from sagulum to PPT dorsal to the DLL. H) Sagulum cells. Transverse sections. Scale bar = 100 μm for A, E, G; 50 μm for C; 20 μm for F; and 10 μm for B, D, H.

