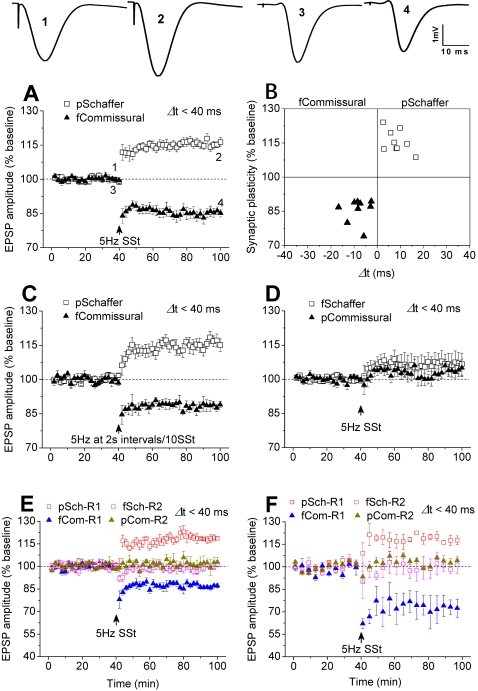
Figure 3. Coincident Schaffer/commissural activity induces LTP and LTD in urethane-anesthetized or freely-moving rats.
A, The stimulation to Schaffer preceding to commissural pathway within a timing window of 40 ms induced LTP in the preceding and LTD in the following pathway (n = 9; pSchaffer: 116.6±1.9%; fCommissural: 84.8±2.0%; P<0.001 vs. baseline of pSchaffer or fCommissural). B, Individual data confirmed consistent LTP and LTD in pSchaffer and fCommissural pathways, respectively. C, Similarly, the modified stimulation, consisted of 600 pulses at 5 Hz with 2 s intervals per 10 pulses, to Schaffer preceding to commissural pathway within 40 ms induced Schaffer LTP and commissural LTD, simultaneously(n = 4; pSchaffer: 116.8±1.5%, P = 0.003 vs. baseline; fcommissural: 88.7±2.1%; P = 0.011 vs. baseline). D, However, when the activity sequence was reversed in which Schaffer followed commissural pathway within a window of 40 ms, the stimulation had no significant effect on synaptic efficacy in either pathway (n = 9; fSchaffer: 106.8±4.9%, P = 0.061 vs. baseline; pCommissural: 104.0±3.8%, P = 0.147 vs. baseline). E, In urethane-anesthetized rats, the stimulation to Schaffer preceded commissural pathway induced LTP in the preceding and LTD in the following pathway at R1, but had no effect on synaptic efficacy in the Schaffer followed commissural pathways at R2, within a 40-ms window (n = 3, pSchaffer-R1 (pSch-R1): 118.4±1.5%, P = 0.005 vs. baseline; fCommissural-R1 (fCom-R1): 87.2±1.4%, P = 0.005 vs. baseline; pCommissural-R2 (pCom-R2); 99.8±1.4%, P = 0.437 vs. baseline; fSchaffer-R2 (fSch-R2): 101.8±3.3%, P = 0.352 vs. baseline). F, In freely-moving rats, the stimulation induced LTP in preceding Schaffer and LTD in following commissural pathway (R1); it had no effect on synaptic efficacy in the reversed sequence (R2), within a 40-ms window (n = 4; pSch-R1: 117.5±3.6%, P = 0.002 vs. baseline; fCom-R1: 72.3±7.2%, P = 0.025 vs. baseline; pCom-R2; 99.9±4.8%, P = 0.3987 vs. baseline; fSch-R2: 103.4±3.4%, P = 0.399 vs. baseline).

