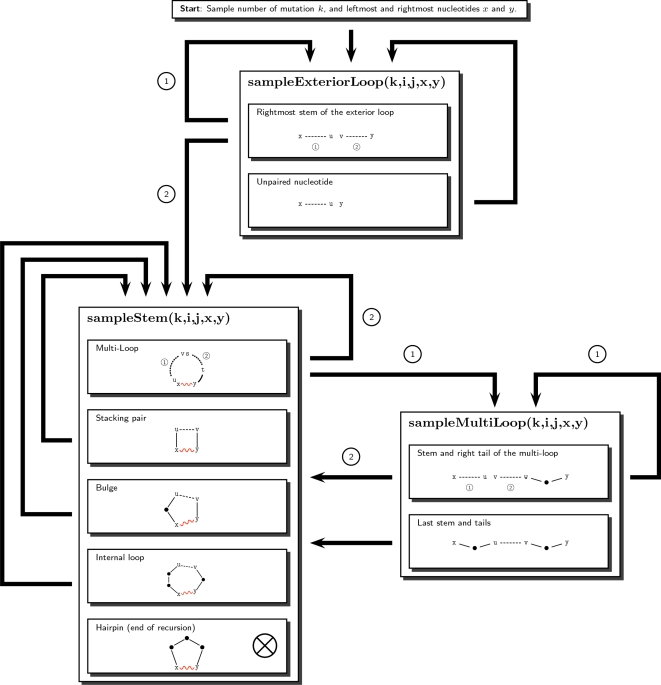
Figure 4. Overview of the sampling procedure.
Dashed lines represent the regions which must be recursively sampled. The recursive calls are indicated by an arrow, and labeled when multiple recursive calls are performed. Wavy lines show the base pairs created duringthe execution of the algorithm. Dots indicate nucleotides sampled in the function and are never involved in a recursive call. The number of mutations is determined using the recursive equations of the section Partition Function for Mutant RNA in Methods.

