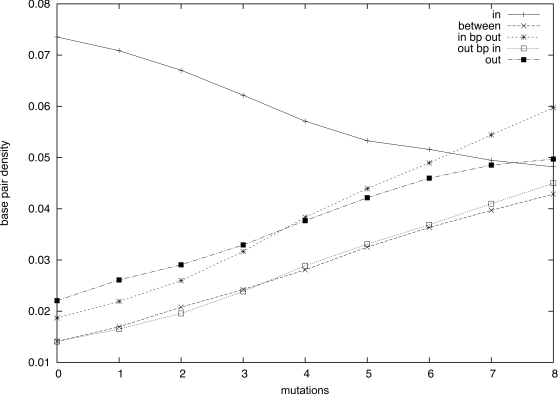
Figure 9. Base pair density in k-mutants (0≤k≤8).
The x-axis represents the number of mutations, while the y-axis represents the (normalized) frequency of base pairs (i, j) (i<j) over all windows containing both extremities i, j. Results are classified into five different instances: (1) i and j belong to the same stem region, (2) i and j are in two different stem regions, (3) i is in a stem region and j is not, (4) j is in a stem region and j is not, and (5) neither i nor j belong to any stem region.

