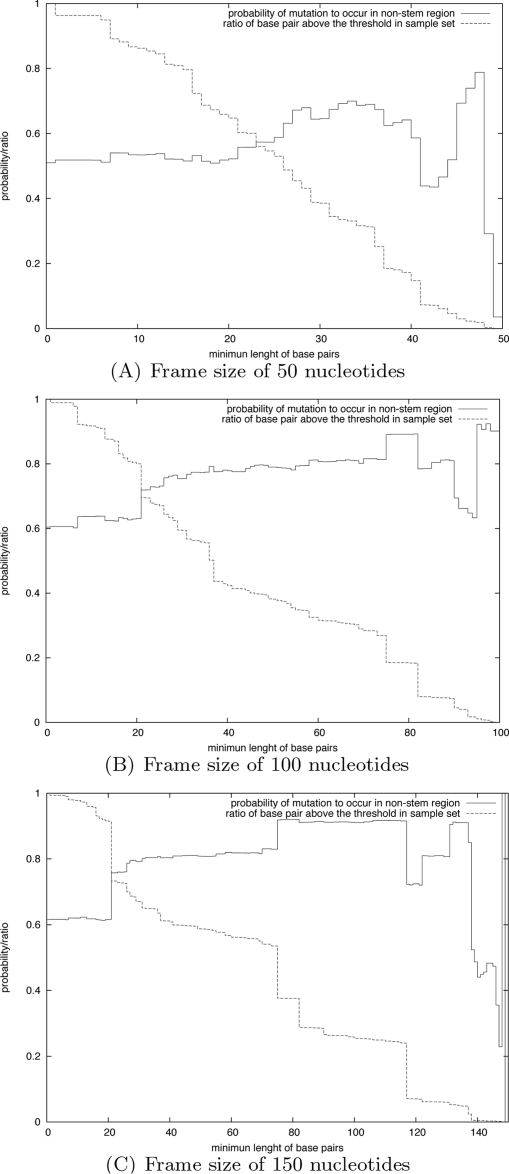
Figure 13. Probability of mutations occurring in a base pair (i, j), whose length j−i exceeds a certain threshold.
The x-axis represents the threshold value for base pair length. Results are reported for frame sizes of 50 (A), 100 (B), and 150 (C). The fractions of mutations satisfying the criteria in the sample set are given using the dashed line.

