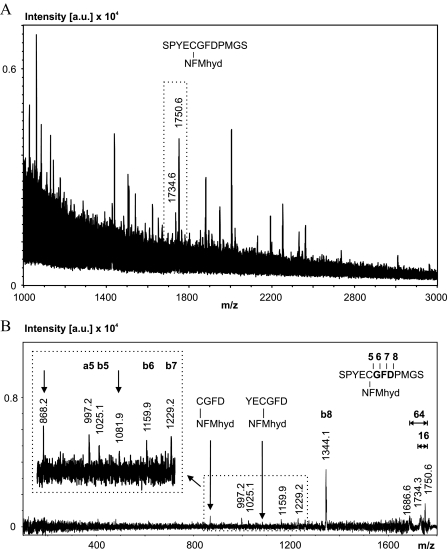
FIGURE 4.
MS and MS/MS analysis of the elastase digest of the fluorescent-labeled ND3 subunit (Fig. 2, spot 1). A, MS spectrum. The signal pair (with unmodified and oxidized methionine) for the NFMhyd-labeled fragment SPYECGFDPMGS is boxed. [a.u.], counts in absolute units. B, MS/MS spectrum verifying the assignment of signals in Fig. 5A. For details, see supplemental Fig. S2.(y ions marked bold; nomenclature for fragment ions according to Roepstorff and Fohlman (Ref. (31)).

