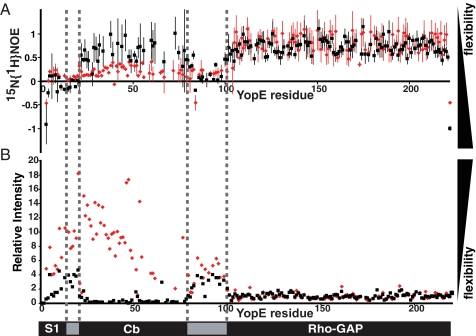
FIGURE 3.
Dynamics of free and SycE-bound YopE. A, 15N{1H} NOE intensity values are plotted for free (red) and SycE-associated (black) 15N,2H-labeled YopE. Error bars were calculated from the spectral noise of the reference experiments. B, 15N,1H TROSY cross-peak intensities are plotted for free (red) and SycE-bound (black) 15N-labeled YopE, with intensities normalized to the mean intensity of resonances from the RhoGAP domain. Samples were prepared by adding either phosphate buffer or unlabeled SycE to otherwise identical aliquots of free 15N-labeled YopE.

