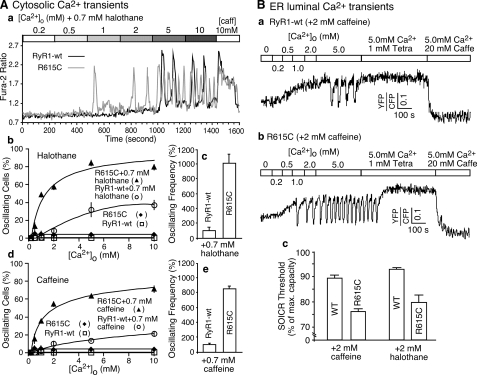
FIGURE 3.
Halothane and the MH R615C mutation increase the propensity for SOICR. A, stable, inducible HEK293 cells expressing RyR1 wt and the R615C mutant were induced with tetracycline for ∼24 h and loaded with 5 μm fura-2 AM in KRH buffer for 20 min at room temperature. The cells were continuously perfused with KRH buffer containing various concentrations of external Ca2+ (0.2–10 mm) and caffeine. Panel a shows single cell fluorescent Ca2+ images of cells expressing RyR1 wt (top panels) and the R615C mutant (bottom panels) in the presence of 0.7 mm halothane at various [Ca2+]o. Fura-2 ratios of representative RyR1 wt (green trace) and the R615C mutant (red trace) cells are shown in panel b. The fraction (%, means ± S.E.) of cells displaying Ca2+ oscillations in the presence or absence of 0.7 mm halothane (panel c) or 0.7 mm caffeine (panel d) is shown. The total numbers of RyR1 wt cells analyzed for Ca2+ oscillations were 320 (without halothane or caffeine), 465 (with 0.7 mm halothane), and 305 (with 0.7 mm caffeine). The total numbers of R615C cells analyzed for Ca2+ oscillations were 290 (without halothane or caffeine), 714 (with 0.7 mm halothane), and 339 (with 0.7 mm caffeine). Panels c and e show the frequency of Ca2+ oscillations at 2 mm [Ca2+]o, in the presence of 0.7 mm halothane and 0.7 mm caffeine, respectively. The values were normalized to the wt level (100%). The data shown are the means ± S.E. from three to five separate experiments. B, the R615C mutation decreases the threshold for SOICR. HEK293 cells expressing wt or R615C were transfected with D1ER cDNA ∼48 h before imaging, and RyR1 expression was induced ∼24 h before imaging. The cells were perfused with KRH buffer containing 2 mm caffeine or 2 mm halothane with various [Ca2+]o, 1 mm tetracaine, or 20 mm caffeine. Representative FRET traces from HEK293 cells expressing either wt (panel a) or R615C (panel b) are shown. The SOICR threshold in cells expressing wt or R615C in the presence of caffeine or halothane is shown in panel c. The threshold for SOICR was determined by calculating the peak luminal Ca2+ level during oscillations as the percentage of the maximum luminal Ca2+ store capacity. The maximum luminal Ca2+ store capacity was estimated by calculating the difference between the maximum luminal Ca2+ level in the presence of tetracaine (1 mm) and the minimum luminal Ca2+ level in the presence of caffeine (20 mm). The data shown are means ± S.E. from two to five separate experiments.

