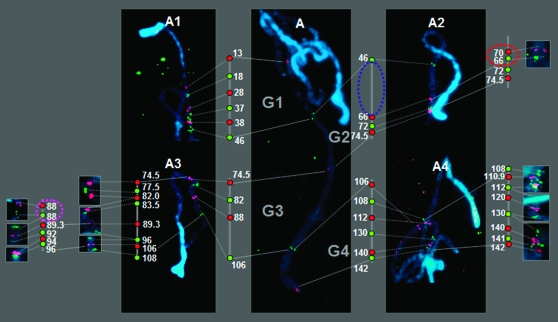
Figure 3.—
Integration of cytogenetic and genetic maps. (A) Pachytene chromosome hybridized using five biotin- or digoxigenin-labeled BAC clones (LE_HBa0303I24, 13 cM; LE_HBa0072A04, 46 cM; LE-HBa0204D01, 74.5 cM; LE_HBa0172G12, 106 cM; LE_HBa0177F12, 142 cM). G1–G4 represent designated genetic distance blocks of 33, 27, 33, and 36 cM, respectively. (A1–A4) Twenty-eight BAC clones hybridized to pachytene chromosome 2. The green and red dots on each line indicate BAC–FISH results from the left and the right, respectively; the distance is not proportional to the actual distance. The blue dotted circle indicates the physical gap. The red dotted circle indicates the reversed order of loci between the genetic and the cytogenetic maps. The pink dotted circle indicates two separate loci that were colocalized in the genetic map.

