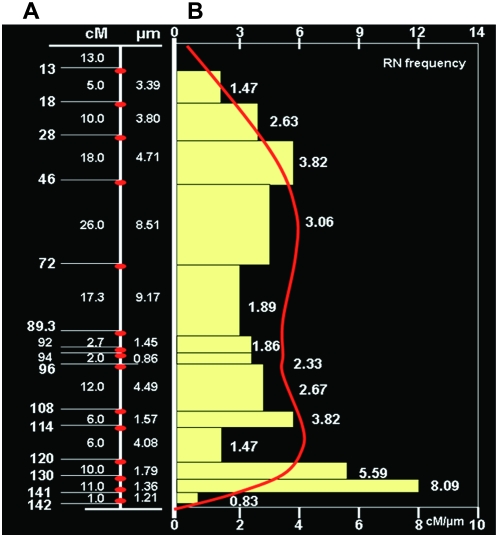
Figure 5.—
Determination of the centimorgan/micrometer relationships. (A) Chromosome diagram with genetic (left) and cytological (right) distances between analyzed loci. Red ellipses indicate the analyzed loci. (B) Comparison of the RN distribution and the centimorgan:micrometer ratio along the length of chromosome 2. The y-axis represents the long arm of chromosome 2. The top x-axis is the number of RNs in 0.1-μm intervals along the chromosome. The bottom x-axis is the centimorgan:micrometer ratio along the chromosome. The red line indicates the general trend in the RN distribution, redrawn from Sherman and Stack (1995). The horizontal bars indicate the ratio of the genetic distance between analyzed loci (values to the left in B) to the cytological distance between the analyzed BACs (values to the right in B). The value of each bar is shown at the right of the bar.

